1: Managing Efficiency in a Quality Organization
By Joe Barbarite, Par Pharmaceutical and Rafi Maslaton, cResults This case study discusses efficiency management throughout the quality operations including QC laboratories and QA operations. In addition, it outlines how Par Pharmaceutical has addressed operational excellence in its quality operations and how it improves its cost effectiveness and enhances its compliance value added contribution to manufacturing and packaging operations at its Spring Valley, New York site. For a full article, please click on the following link: http://www.nxtbook.com/ygsreprints/ygs/phpr_1-24628441/ An abstract: Among the building blocks to achieve operational excellence, resource planning and scheduling is one of the key contributors to reach these goals.Some of the key achievements of the 6 months of implementation were:
- More than 20% efficiency gain in the QC labs, which translates into major cost reduction / avoidance (i.e., reduced temp; over time). More than 1 million dollars per year in total savings compared to the previous year.
- Raw materials backorder was greatly reduced due to reengineered business processes and improved visibility
- Walking distance was reduced by 25% (~1,250 miles per yr.)
- Improved on-time delivery and delivery consistency (i.e., NO Backlog due to lab performance)
- Planning standards, scheduling strategy and Dashboard became the core of the continuous improvement infrastructure Many of the above were achieved due to a robust planning and scheduling business process and information system as well as the creation of Key Performance Indicators (KPI) and a dashboard that leverages the detailed standards and the scheduling system.
2: Reduce Cycle Time and Improve On-Time Delivery
A leading pharmaceutical manufacturing facility in upstate New York, manufactures a line of pharmaceutical products which includes brand name OTC products as well as Rx. The manufacturing organization was experiencing constant demand fluctuation and product mix changes, while being required to meet aggressive on-time delivery and turn-around time goals. As a critical component in the manufacturing process, the QC labs (and specifically the raw material lab) were facing a number of major issues:
- A leading pharmaceutical manufacturing facility in upstate New York, manufactures a line of pharmaceutical products which includes brand name OTC products as well as Rx. The manufacturing organization was experiencing constant demand fluctuation and product mix changes, while being required to meet aggressive on-time delivery and turn-around time goals. As a critical component in the manufacturing process, the QC labs (and specifically the raw material lab) were facing a number of major issues: A serious lack of resources but no capabilities and tools to develop a quantitative business case to support additional resources requests
- LIMS systems generated hardcopies of requested data
- Lack of visibility regarding new production schedules and/or new product introductions
- Lack of efficient scheduling – analysts would pick and choose the test they were interested in performing at the moment
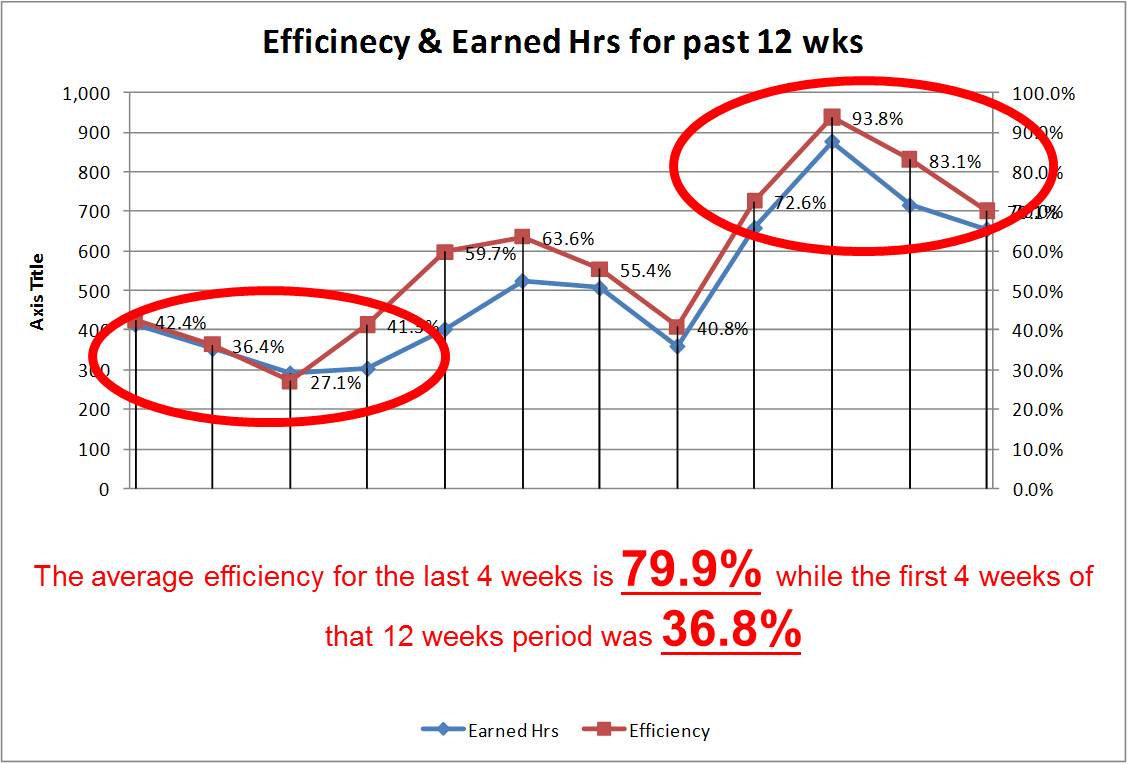
A joint team implemented a Resource Planning and Scheduling (Smart-QC) tool in 3 months. The implementation of the resource planning and scheduling solution, resulted in over 40% in assay turn-around time reduction, a 150% increase in throughput and schedule attainment that improved from 40% to 90-95%
3: Increasing campaign size and overall lab efficiency
A leading Generic manufacturing facility in NC was seeking for improvement in their lab efficiency to enable the organization to manage larger volume with the same number of peopleThe key opportunities identified by the operation excellence team were:
- Improve campaigning throughout the labs to drive efficiency improvement
- Improve communication & visibility for all functions, to reduce non value added activities
- Provide clear prioritized schedule for the lab chemist
- Improve overall QC Lab transparency and information flow with supply chain
- 5. The implementation of Smart-QC resulted in major improvement in the overall campaigning; during 2010 average campaign size was: 2.5 sample-tests
- Since the deployment of Smart-QC began in Jan-21, campaign size is averaging: 4.2 sample-tests
- This represents about 20% efficiency gain
Lower campaign size in 2010 was due to lack of robust scheduling tool and process. Planning required significant rush samples to be released which reduced overall flexibility.