Smart-QC provides over 50 reports templates for both scheduling and planning as well as several dashboards. These include line charts, bar charts, stacked bar charts, pie charts and more.
The reports for Scheduling are organized in categories such as:
- Projection Report
- Throughput
- Efficiency and Utilization
- Lab Support
- Key Performance Indicators
- Review Right First Time
- Re-Test
For Resource Planning
- Resource Requirement
- Product & Test Level Requirement
- Lab Support Activities
- Campaigning Batching Effect
- Qualifications and Trainings
The user interface is simple and provides various filters, charts, time periods etc.: Smart-QC provides the level of details you need to effectively manage you overall lab’s activities and see what was tested, audited, and finally approved. It shows in color if the completion took place within the desired due date
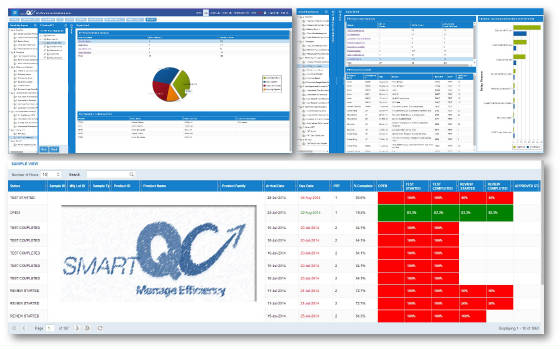
Report UI
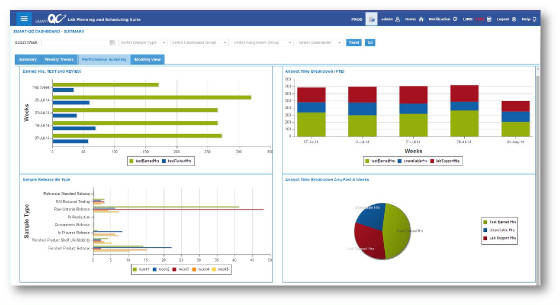
One of several Dashboard Available in Smart-QC