Moving stability off shore – is it a good move YES and here is why
November 19, 2015
Campaigning or over campaigning
January 4, 2016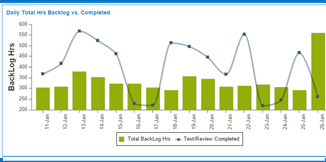
In our previous blog “backlog and efficiency”, we discussed the relation between having a backlog and leveraging the backlog as an efficiency leading indicator and continuous improvement vehicle. Some of our readers asked us to define in more detail the process of calculating the backlog.
Our approach is to calculate based on Standard’s total hours represented by the samples logged in and their status. For example, if we have 100 samples in different stages and the total HOT for both TEST and REVIEW are 1,000 hrs, and we have 25 FTE that on average each produce 20 hrs per week for test/review combined, then the backlog in weeks will be 1000 / [25 X 20] = 2 weeks. The key is to be able to be able to track this backlog daily to identify trends and potential issues. In addition, the users of Smart-QC via the integration with the ERP system can see the upcoming samples from RM, MFG, and STABILITY. In general, any future sample that will arrive to the lab may wait up to 2 weeks before the lab analyst can start the testing. Critical in managing backlog is not to use FIFO. In some cases, although some of the samples arrived before other samples, the new one may have a longer test that unless starts immediately we will miss the targeted due date; where other samples that arrived earlier may be quicker to release and even if these be delayed by a couple of days, they can still make the due date. In summary, backlog is a combination of all work logged in to the lab and its representation of the HOT for each lab compared with the lab resources. When backlog is trending upward, it is a sign of out-of-control situation and unless carefully managed with the goal in mind of increasing the campaign size of the lab, the lab will never be able to catch up.
